Is Japan a long-term opportunity?
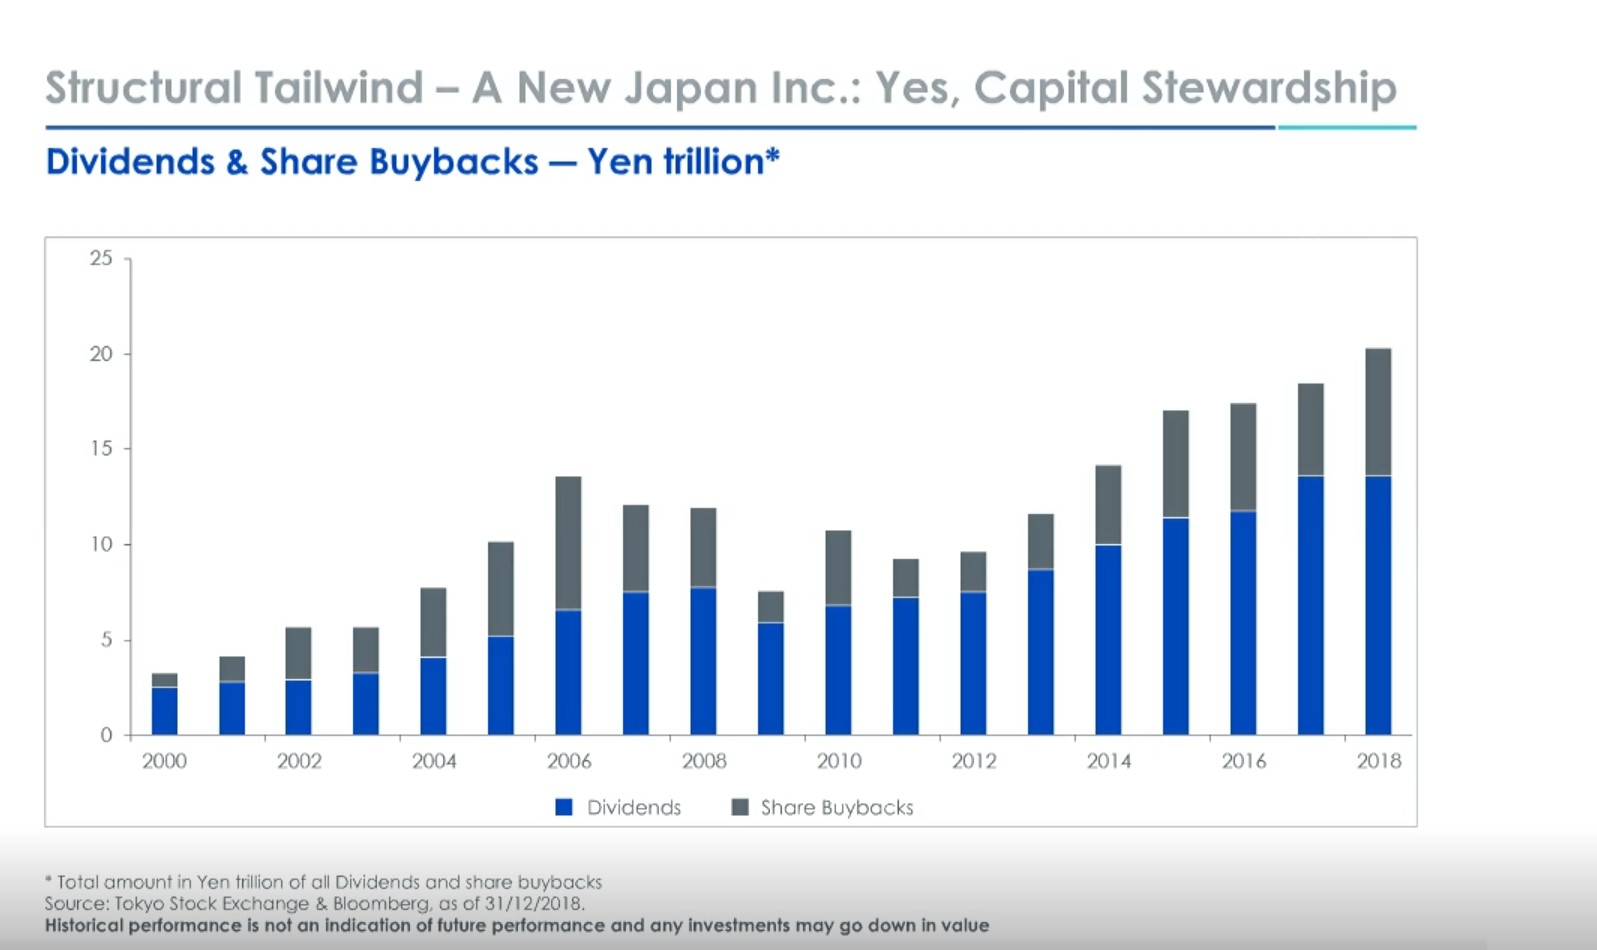
Japan is leading the international markets in terms of underlying dividend growth. Companies in the land of the rising sun have been steadily increasing their dividend payouts, helped by their stable profit margins and cash hoards. The estimated dividend yield on the Topix 500 index, which tracks large Japanese companies, is about 2.5%, according to a recent note by Société Générale Cross Asset Research.
The dividend yield, which had mostly remained steady since 2013, has been moving up recently, “indicating that Japan Inc. is getting more used to the idea of paying out cash as dividends,” according to Société Générale Cross Asset Research.
Looking across regional indexes, whether looking at the trailing three-year or trailing five-year changes in dividends, Japan1 stands out from broad international indexes like MSCI EAFE or MSCI Europe. The five-year numbers come in at almost double digits - very close to the U.S. markets. For the latest three years, Japan came out with a dividend growth figure higher than the U.S. Over the last ten years - a period that includes the financial crisis - eurozone regional indexes still show lower overall dividends in 2017 than they did in 2007. Again, the three-year dividend growth shows a meaningful pickup recently.
Domestic Growth Driver
The economy grew at a slower pace than initially estimated in the second quarter as the United States-China trade war prompted a downward revision of business spending, intensifying calls for the central bank to deepen stimulus this month. Weakness in the global economy and trade protectionism has emerged as risks to growth and added some pressure for the Bank of Japan (BOJ) to expand stimulus when it meets next week. The economy grew an annualized 1.3 percent in April-June, weaker than the preliminary reading for 1.8 percent annualized growth, revised Cabinet Office data. The annualized growth rate translates into a quarter-on-quarter expansion of 0.3 percent from January-March, compared with a preliminary reading for a 0.4 percent gain. The outlook for the world’s third-largest economy remains clouded as risks from declining manufacturing overseas and at home hit exports. Analysts have also warned of a possible drop in domestic consumption after Japan raises its sales tax to 10 percent next month, which could run one of the economy’s few growth drivers. Amid the risks to growth, BOJ Governor Haruhiko Kuroda has kept the door ajar for cutting interest rates further into negative territory, saying last week such a move is among the bank’s policy options. Speculation is growing that the BOJ could ease policy as early as this month to prevent the yen from spiking, an increasingly likely prospect if the U.S. Federal Reserve and the European Central Bank unveil new easing measures.

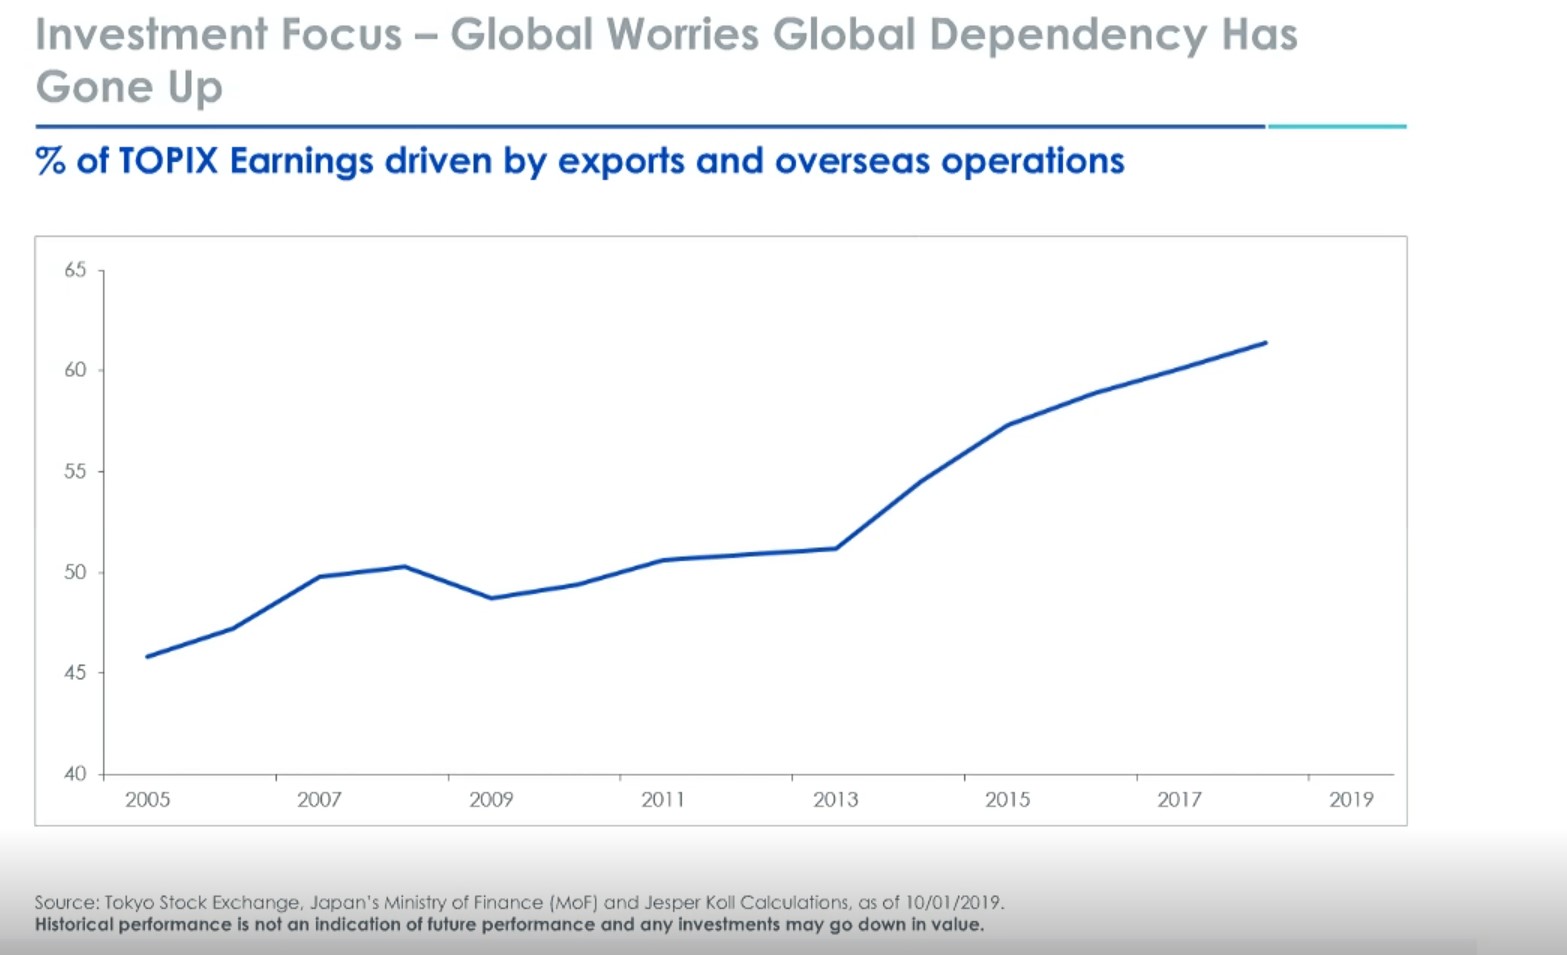
Investment Focus
In 2013, the ratio of Japan’s inward FDI stock to its GDP was 3.5 percent, the lowest among developed countries, and far below the global average of 34.1 percent. The U.S. and Germany, for instance, have ratios seven to eight times higher than Japan, while China and South Korea have ratios three to four times that of Japan’s. Inward FDI in developed countries is characterized more by mergers and acquisitions (M&A) - involving buyouts of existing companies - than by greenfield investments entailing the establishment of new companies. In this context, M&A by foreign companies in Japan is sluggish. Receiving direct investment from international companies promotes economic growth by increasing venture, production, and employment. But the benefits of receiving direct investment are not limited to these quantitative expansions. They also include qualitative improvements through transfers of advanced technology and management know-how to Japanese companies. Higher productivity also stems from intensified competitive pressure on Japanese companies.
Similarly, consumers benefit from the availability of new products and services. Aware of the contributions inward FDI could make to Japan’s economic recovery and medium- to long-term growth, the Abe administration - in a revised version of its Japan Revitalization Strategy released in June 2014 - advocated expanding inward FDI. The strategy aims to double the 2012 year-end inward FDI stock by 2020. This expansion is a crucial part of the third arrow of Abenomics’ approach to growth. What factors hinder inward direct investment in Japan? In opinion surveys of foreign companies conducted by the Japan External Trade Organization (JETRO), the Ministry of Economy, Trade, and Industry and others, the problem most commonly cited by foreign companies seeking to operate in Japan is the high cost of doing business. Specifically, the high corporate and other tax rates applicable to companies and high office rents. Among the other obstacles noted were: the closed and peculiar nature of the market and administrative procedures, the complexity of approval and licensing systems, the difficulty of securing needed personnel, and, in particular, the scarcity of staff capable of communicating in English.
Surveyed companies pointed out that M&A in Japan is sluggish. They said that this is due in part to tax regimes and procedures that make it harder to pursue M&A than in other developed countries and in part, to the significant barrier of closed corporate governance in Japanese companies that inhibits M&A. Recognizing the need to expand inward FDI, since the 1980s, the Japanese government has been pursuing a variety of policies to encourage such investment - offering foreign companies low-interest loans, tax breaks, debt guarantees, and useful information. The second Abe administration, inaugurated in 2012, sought to reduce or eliminate factors inhibiting investment in Japan by setting targets to double inward investment, creating a council for foreign direct investment promotion to help achieve these targets, and implementing regulatory reforms. Japan is still leading the Southeast Asia infrastructure race against China, with pending projects worth almost one-and-a-half times its rival, according to the latest data from Fitch Solutions. Japanese-backed projects in the region’s six largest economies – Indonesia, Malaysia, Philippines, Singapore, Thailand, and Vietnam – are valued at US$367 billion, the figures show. China’s tally is US$255 billion. The figures underline both the rampant need for infrastructure development in Southeast Asia, as well as Japan’s dominance over China, despite President Xi Jinping’s push to spend on railways and ports via his signature Belt and Road Initiative. The Asian Development Bank (ADB) has estimated that Southeast Asia’s economies will need US$210 billion a year in infrastructure investment from 2016 to 2030, to keep up the momentum in economic growth. The latest Fitch figures count only pending projects – those at the stages of planning, feasibility study, tender, and currently under construction. Fitch data in February last year put Japan’s investment at US$230 billion and China’s at US$155 billion.
Portfolio Rebalancing Global Investors
The portfolio rebalancing channel – achieved through large-scale purchases of assets – is one of the major transmission channels envisaged by a central bank under the zero or effective lower bound (Joyce et al. 2012). To realize this channel, the Bank of Japan (BOJ) launched quantitative, qualitative monetary easing (QQE) in April 2013 by the large-scale purchase of Japanese Government Bonds (JGBs) with the maturity extended to the maximum 40 years. In September 2016, the BOJ shifted the official guideline for market operations from the monetary base (hence the amount of JGB purchases) to the 10-year yield (with a negative interest rate of -0.1%). At the same time, the BOJ emphasized a continuation of an annual pace of JGB purchases of about ¥80 trillion – suggesting its high evaluation of this channel. This column will assess whether the portfolio rebalancing channel has been active in Japan by focusing on the three entities – financial institutions, firms, and households, separately.
The portfolio rebalancing channel raises aggregate demand, and hence inflation, by encouraging investors to change the composition of their portfolios, thereby lowering funding costs and raising various asset prices directly. The BOJ expanded its degree of monetary accommodation substantially (as evidenced by the ratio of the BOJ’s assets to GDP has exceeded 90%), and has also purchased risk assets directly, such as exchange-traded funds and real estate investment trusts. Therefore, the BOJ has envisaged that portfolio rebalancing of financial institutions would take place forcefully, from safe assets (i.e., JGBs) to risk assets (such as bank loans, M&A, outbound foreign direct investment, and other domestic and international securities investment). Together with the banking sector’s provision of innovative financial services, households’ portfolios would be rebalanced from safe assets (such as bank deposits and cash) to risk assets (such as residential investment, investment in equity investments, and investment trusts, etc.). Firms would be encouraged to shift from holding bank deposits and cash to expanding business fixed investment, M&A domestically and overseas, R&D, outbound foreign direct investment (FDI), and so on. In other words, the unprecedented massive monetary easing is aimed at energizing Japan’s economy by promoting ‘healthy’ risk-taking behavior among financial institutions, households, and firms, which has been lacking since the collapse of the equity and real estate bubbles in the early 1990s.
The bank loans to deposit ratio declined rather than increased is unique among advanced economies in terms of the abundance of deposits relative to the size of the financial industry. For example, deposits and currency held by Japanese banks accounted for 45% of the total liabilities of all financial intermediaries (covering depository corporations, pension funds and insurance firms, and other financial institutions) in June 2016. The ratio is higher than that of the Eurozone (34%) and the U.S. (16%), according to the BOJ estimate using the flow of funds data (BOJ 2016). Focusing on depository corporations in Japan, bank deposits have substantially exceeded bank loans. The limited demand for credit relative to abundant bank deposits is a structural phenomenon, as evidenced by the persistently low bank loans to deposit ratios. The ratio dropped from 66% in 2000 to 53% in 2016 (Figure 1). This reflects that the pace of an increase in bank deposits has been faster than the speed of growth in bank loans.
The Outlook For The Shrinking Markets Of Goods And Services
JGB holdings mainly fill the gap between loans and deposits. This suggests that abundant capital has not been utilized efficiently for productive purposes in the private sector. Long-standing limited demand for credit reflects not only the actual rapid pace of aging and its declining population but also the outlook for the shrinking markets of goods and services.
Since 2013, Abenomics and QQE have enabled stagnant loan growth to turn positive, and the year-on-year loan growth has since remained at around 2%–3%. As for corporate loan growth, more than 50% of the growth has been allocated to the real estate sector. Growth of households’ mortgage loans showed a moderate pick up. Growing bank lending to the real estate sector has been related to loans to real estate investment trusts, construction activities (partly related to the 2020 Tokyo Olympic Games), as well as loans to housing for rent (mainly driven by tax-saving purposes as a result of the tighter inheritance taxation). Nevertheless, loan growth remains too moderate to offset a decline in the interest rate margins. Deposit growth, rather than slowing, grew even faster than bank loans as explained below; thus, the already low loan-deposit ratio dropped even further – contrary to the phenomenon expected under the portfolio rebalancing channel.
Figure 2 indicates that the ratio of loans to total financial assets has declined over the past four years. The decline in the ratio of debt securities’ holdings (comprised mainly of the JGBs) – mostly as a result of selling the JGBs to the BOJ – was replaced by an increase in deposits (primarily comprised of the current account balances at the BOJ). The ratio of foreign investment did not show a rising trend over the same period. This reveals that the portfolio rebalancing channel has not been reliable to the extent expected by the BOJ, although it has been successful in lowering lending rates. Households traditionally prefer bank deposits. Deposits and currency accounted for around 50% of households’ total financial assets from 2000 to 2016 (Figure 3). Such large-scale holdings of deposits are quite remarkable, given that the deposit interest rate is about 0%. The household sector has remained a substantial net creditor as households’ deposits (about ¥940 trillion currently) have significantly exceeded their loans (about ¥310 trillion) for a long time. Since their deposits grew faster than their loans, the deposits to loan ratio rose moderately over the period since the adoption of the QQE – contrary to the phenomenon expected under the portfolio rebalancing channel.
QQE contributed to raising households’ equity and investment fund shareholdings as a share of total financial assets moderately from around 12% in 2013 to 13%–14% in 2016. However, the ratio did not exceed the maximum (17%) reached in 2007 before the Global Crisis. The household sector remained a net seller of stocks most of the time over the past four years – partly because stock prices rose but achieved only about a half of the historically highest level achieved in the past, and partly because of large fluctuations of the stock prices. Households’ holdings of debt securities accounted for only 1%–2% of total financial assets over the same period partly because a wide range of JGBs and other corporate bonds are available to professional investors as compared with households. Also, the corporate bond market is too small.
Japanese Firms, Highly Risk-Averse
The risk-averse behavior of Japan’s households is in contrast with that of households in the U.S. and the Eurozone. According to the BOJ’s estimates, deposits and currency accounted for 52% of households’ total financial assets in Japan in September 2016 while they accounted for only 14% in the U.S. in September 2016 and 35% in the Eurozone in June 2016. Equity holdings and investment trusts accounted for 46% in the U.S. and 25% in the Eurozone, while only accounting for 13% in Japan.
Japanese firms are known to be highly risk-averse, as demonstrated by their vast holdings of deposits and currency. The amount of deposits and currency held rose at an accelerated pace from 2013, owing to an increase in corporate profits. In 2016, the number of deposits and currency exceeded ¥240 trillion – about one-fourth of the firms’ total financial assets and about 45% of GDP. The high profitability was attributable to various favorable factors: the yen’s substantial depreciation, low lending rates, a series of corporate tax cuts, a sharp decline in commodity prices and imported materials in 2014–2016, and an increase in foreign demand since 2015.
This reflects firms’ choice to accumulate profits in the form of retained earnings rather than allocating them more intensively to expanding business fixed investment, M&A, R&D, foreign portfolio investment, and outbound FDI. While firms increased their non-residential fixed investment over the past four years, the amount of increase was moderate and remained well below cash flows or change in deposits and currency. Since 2013, firms have expanded outbound FDI, but the growth was average, and foreign assets related to FDI accounted for only half of deposits and currency in 2016. In the U.S., meanwhile, firms also increased their holdings of deposits due to an increase in profits over time and achieved about US$1 trillion in December 2016. However, the outstanding amount of deposits is relatively small compared with Japan, accounting for only 5% of firms’ total financial assets and 5% of US GDP. Besides, U.S. firms actively engaged in outbound FDI so that the number of foreign assets related to FDI recorded US$5 trillion, which is about five times as large as deposits. Firms’ non-residential fixed investment exceeded cash flows or change in deposits.
Equity Market: Profits Are Up, Deflation Is Over
Yet Japan’s stock market is widely reviled, valued even more cheaply than the struggling Eurozone.
Investors think Prime Minister Shinzo Abe’s “three arrows” of loose monetary policy, fiscal stimulus and reform of capital and jobs markets have misfired since he started Abenomics in 2012, and that they won’t reach their mark any time soon. Japan’s stock market is dominated by economically, and currency-sensitive cyclical stocks whose profits have soared but could crash back to the ground if the global slowdown worsens. Investors don’t value such cyclical benefits very highly anywhere, and they value Japan’s cyclical profits even less. Yet Abenomics isn’t such a dud as many investors seem to think it scored some hits—and Japan’s stocks merit watching if the global economy turns up.
It is both evident that Abenomics hasn’t hit its target, and at the same time, overly harsh to deem the prime minister’s efforts a complete failure. Inflation remains well below the 2% goal set shortly after his election, despite some of the loosest monetary policy ever seen outside Zimbabwe. But after almost two decades of deflation, the fact that there’s any inflation at all is a triumph.
Government spending didn’t offer much of a boost, and Mr. Abe shot the fiscal arrow into his foot in 2014 when his sales-tax rise caused a recession. The overall government budget is on track for the smallest deficit next year since the post-bubble recession of 1993, according to estimates by the International Monetary Fund, something which can’t help inflation. The reform program has helped encourage better allocation of capital by companies and supporting the existing trend of more women joining the workforce.
Earnings per share have risen faster even than in the U.S. recently, according to MSCI data. And figures collected by the Ministry of Finance show operating profit margins for big nonfinancial companies not far from the peak of 8.6% reached in the second quarter of last year, far above the 2007 high of 5.7%.
Historically, shareholders wouldn’t give companies credit for high profits because they could never get their hands on the money. Better corporate governance gives hope that less of it will be frittered away, and should support valuations. At the same time, Japanese manufacturers have improved their productivity since Abenomics began, at a time when most of the developed world has seen productivity growth slow, according to Conference Board data. (The Bank of Japan puts part of the blame for too-low inflation on productivity growth.)But there’s still a problem: Japan’s huge manufacturers are heavily exposed to global trade troubles and the value of the yen, and profit margins have been falling fast as both moves against them.

Japan’s Manufacturing Productivity
Real value added per hour worked in manufacturing, annual change
The nonmanufacturing sector hasn’t been hit the same way, but its operating profit margin of 5.4% has been flat since 2016. That doesn’t support a story of continuous improvement, even if it is far above the pre-Abe norm.
Shigeto Nagai, a former BoJ official now at Oxford Economics, argues that the single most significant change produced by Abenomics was to correct the overvaluation of the yen, which helped exporters most. The relatively muted gains of the yen in the race to safety this summer supports the idea that there’s less danger to Japanese stocks from a stable currency, but it’s too early to be sure.
The overall valuation of the market shouldn’t mislead investors looking for cheap stocks. MSCI Japan trades at 13.3 times estimated 12-month-forward earnings, precisely in line with the world excluding the U.S., and far behind the U.S.’s 17.4 times.
The country has the cheapest financials, the cheapest industrials, and the most affordable consumer discretionary companies, a sector that includes upmarket retailers and carmakers. Those three sectors account for half the market, more than the U.S., U.K., Eurozone, or emerging markets. If the world economy picks up, these stocks should do well, but few want to make that bet at the moment.
Look at the more defensive sectors, and the bargains are hard to see. Makers and sellers of consumer staples (such as toothpaste, alcohol, and tobacco) are more expensive than in other developed markets, as are health-care stocks. Japan’s energy and utility sectors are cheap. Still, the fourth-biggest utility by market value is Tokyo Electric Power Co., of Fukushima meltdown infamy, which trades at just 3.7 times forecast earnings. The energy sector is tiny, and its most significant stock barely profitable.
Investors who think the world economy can escape the doldrums and trade wars be resolved should consider Japanese stocks. Others should take heart from improving productivity and corporate governance and the possibility that the yen is losing some of its haven statuses, but shouldn’t get too excited by the cheapness.